kuma
What it shows
The state of an Uptime Kuma status page at a glance.
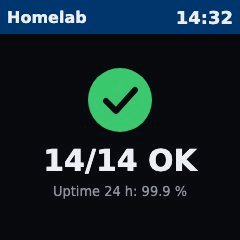
- Everything up: a big green check,
14/14 OKand the average availability of the last 24 hours. Monitors that are still being checked (pending) get an orange line, for example1 being checked. Monitors in maintenance count as up. - Something down: the header turns red and shows how many services are down (
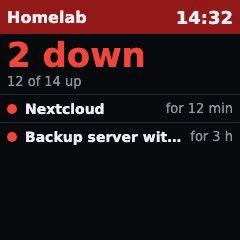
2 down), how many are up, and a row for each failed service with the time since when (for 12 min,for 3 h,for 2 d). Up to four rows fit. More are summarized as+ 2 more. If Kuma has no earlier up beat for a service, the time is a lower bound, for example≥ 40 min. - No connection: an orange notice
Cannot reach Uptime Kumawith the time of the last attempt. The page never keeps showing an old "all OK". - Empty status page: the notice
No monitors on this status page. - Only pending: if no monitor is up yet and all are still being checked, for example right after Kuma started, an orange notice
Being checkedwith0/3 OKinstead of the green check.
Pending and maintenance never turn the header red.
What you need
- A running Uptime Kuma 2.x that the Glance Box server can reach over the network.
- A status page in Kuma with your monitors on it.
1. Install Uptime Kuma
If you do not have it yet, create a docker-compose.yml on a machine in your home network:
services:
  uptime-kuma:
    image: louislam/uptime-kuma:2
    restart: unless-stopped
    ports:
      - "3001:3001"
    volumes:
      - ./kuma-data:/app/data
Start it with docker compose up -d, open http://<host>:3001/ and create the admin account.
2. Add monitors
The recommended way is HTTP(s) monitors on the web addresses of your services (router page, NAS, Pi-hole, Home Assistant, ...). They need no special rights on anything.
3. Create a status page
In Kuma choose Status Pages, then New Status Page. Give it a name and a slug (for example home), add your monitors to a group and save. The slug is the last part of the address, http://<host>:3001/status/home.
Example
- type: kuma
  url: http://192.168.1.20:3001
  slug: home
  lang: en
  refresh: 30
Options
| Key | Default | Meaning |
|---|---|---|
url |
Address of your Uptime Kuma, starting with http:// or https://, without the /status/... part. Required. |
|
slug |
Slug of the status page: lower-case letters, digits and -. Required. |
|
title |
the title of the status page | Header text. |
lang |
top-level lang |
de or en. Sets all texts on the page. |
refresh |
refresh default |
We recommend 30. Kuma caches the answer for a minute, so lower values bring nothing. |
duration |
interval |
How many seconds the page stays on the display. |
Setup
- Add the example to the
pages:list inconfig.yamlwith yoururlandslug. - Restart the server:
docker compose restart. - Open
http://<server>:8080/and check the preview.
Privacy & security
- The status page is readable by anyone who can reach Kuma. The server reads only this public page and needs no login and no key. Do not put monitors on it whose names reveal things you want to keep private, and do not expose Kuma to the internet just for this page.
- Kuma's Docker container monitor gives Kuma access to Docker, and that is access to your whole machine. Prefer HTTP(s) monitors. If you want container monitors anyway, put a socket proxy with read-only access in between, for example
tecnativa/docker-socket-proxywithCONTAINERS=1and every other permission set to0, and never mount the raw/var/run/docker.sockinto Kuma. - Nothing is stored on the Glance Box server beyond the current picture.
When something is wrong
Cannot reach Uptime Kuma: the server could not get the status page. Checkurlandslug, that Kuma is running, and that the status page is published. From the server,curl http://<host>:3001/api/status-page/<slug>must return JSON. The reason is indocker compose logs.No monitors on this status page: the status page exists but has no monitors in any group.- The server refuses to start and names
slugorurl: the slug may only have lower-case letters, digits and-; the url must start withhttp://orhttps://. - A service shows
≥ ...: Kuma only has down beats for it in the recent history, so the real outage may be longer.